|
Larry’s note: Welcome to Trading with Larry Benedict, the brand new free daily eletter, designed and written to help you make sense of today’s markets. I’m glad you can join us. My name is Larry Benedict. I’ve been trading the markets for over 30 years. I got my start in 1984, working in the Chicago Board Options Exchange. From there, I moved on to manage my own $800 million hedge fund, where I had 20 profitable years in a row. But these days, rather than just trading for billionaires, I spend a large part of my time helping regular investors make money from the markets. My goal with these essays is to give you insight on the most interesting areas of the market for traders right now. Let’s get right into it… |
I often discuss the various ways I keep a handle on the economy…
After all, it’s the economy that drives the markets… not the other way around.
That’s why I write about things like home construction and industrial stocks, for example. Both offer great insights into economic activity.
Another equally important gauge is consumer spending.
In the U.S., private consumption accounts for nearly 70% of GDP. Given that high number, it’s pretty clear just how important it is to the economy.
Back in August, I wrote about two different types of spending – both staples (essentials) and discretionary (non-essentials) spending.
I watch the latter for two main reasons… First, it tells me how much income private consumers have at their disposal. And secondly, how much they are willing to spend.
Because of that, I often view discretionary spending the way you might view market sentiment… it gauges consumers’ confidence in the health of the economy.
One way I monitor this sector is through the Consumer Discretionary Select Sector ETF (XLY).
When I wrote about XLY back in August, it was heading into an important territory. Today, I’m going to revisit that to see how things panned out… and where we’re at now.
So, let’s pull up the chart…
XLY Price Chart

Source: eSignal
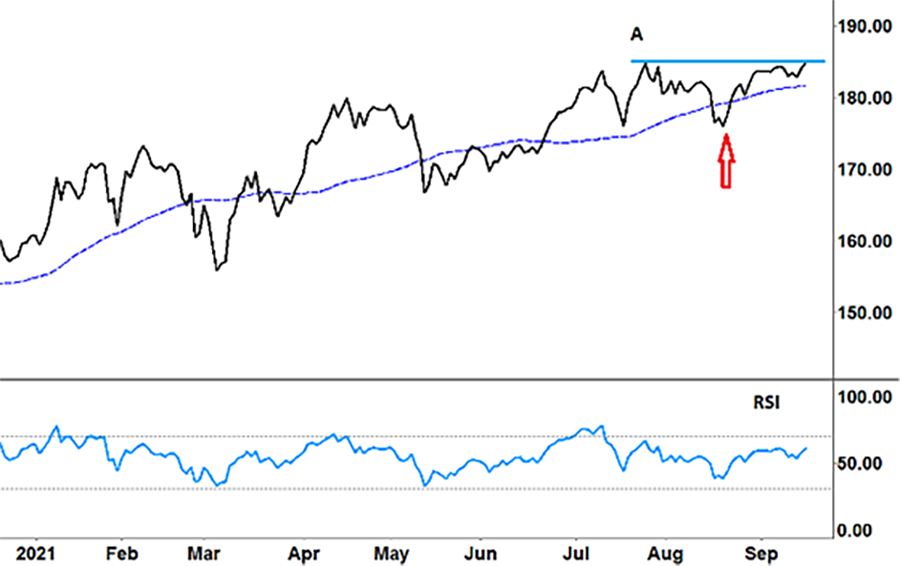
When we looked at XLY, it had just broken down through its long-term trend, or 50-day moving average (MA – blue dotted line). The red arrow on the chart reflects this.
I wanted to see if XLY would bounce back again. To do that, we used one of our other regular indicators – the relative strength index (RSI).
When we looked at XLY last time, we saw just how useful the RSI is…
We saw that each time XLY fell below its 50-day MA, it coincided with the RSI forming a trough. This had happened six times in 11 months.
However, the key takeaway was that each time this happened, XLY went on to make a higher high. And as the RSI turned up from an oversold position (anything near or below the 30 level), XLY broke back above its 50-day MA and rallied to a new high.
Had you used both signals together to go long, that would have resulted in multiple profitable trades.
And right now, XLY is right on the cusp of doing this a seventh time.
When we looked at XLY in August, it had fallen from its then all-time high of $184.65 (‘A’). But as you can see now, XLY is again pushing to make a new higher high by breaking through the horizontal blue line.
The RSI is also showing upwards momentum…
If XLY breaks through and holds that blue line, it means that its long-term uptrend (that began in March 2020) remains intact.
From a trading perspective, it shows yet again how useful simple indicators can be. In this case, by combining a simple MA with the RSI, we have now seen multiple potential winning trade setups in less than a year.
However, more broadly, XLY’s uptrend shows that discretionary spending continues to rise, and that is good for the economy.
Regards,
Larry Benedict
Editor, Trading With Larry Benedict
Reader Mailbag
Today we received some good feedback on my recent Quad Witching trades…
Hi Larry and team… I just wanted to let you know that I just started your service yesterday. That said, with my very first trade that you recommended, I made back your fees plus some profit. Nice call. I look forward to more trades with you.
– David C.
Larry, great trade you set up for us. I wasn’t sure about there being a reversion so quickly, but I took the trade and just closed for a $1K profit. Thanks.
– Joe O.
And we received some kind words regarding my eletter…
You provide good analysis and are one of the few that I read and heed.
– DG J.
Larry,
I wanted to comment on your new eletter…
This is a real education that all of us should be able to utilize. Your recommendations are more than appreciated but the learning will last forever. Thanks!
– Jim G.
P.S. We’re excited to hear what you think of your new eletter, Trading With Larry Benedict. Let us know at [email protected].